Why “normal” isn’t normal anymore
The most-quoted number in weather — the “normal” high and low for today’s date — describes a climate that no longer exists. Every weather app knows it, and every weather app keeps using it anyway. This page explains where that number comes from, why it misleads, and why we stopped pretending.
Where “normal” comes from
When your weather app says today’s high is “five degrees above normal,” that normal is a climate normal: a 30-year average, recalculated once a decade, defined by international convention since the 1930s. The current U.S. normals average the years 1991–2020 and will be used until 2031.
A 30-year average describes the middle of its window best. The middle of 1991–2020 is mid-2005. So every “normal” you hear today is, at heart, an estimate of the climate of 2005 — a two-decade-old snapshot, aging one more year every year until the next update.
Why that mattered less before — and matters now
When the 30-year convention was set, climate was treated as stable: any 30-year window described the next decade about as well as any other. That assumption no longer holds. Averaged across the United States, temperatures have risen steadily for five decades, which means a backward-looking average is now a systematically biased estimate of the present — always too cold, by a predictable amount.
The bias is not hypothetical. In the median U.S. county, the official normal high now runs +0.7°F behind the actual climate. In the most-affected counties the year-round gap approaches +2.0°F, and on individual winter days it exceeds +2.5°F. NOAA’s own scientists have studied the problem for years: the agency has published research on “optimal climate normals” and hinge-fit trend estimates precisely because a former chief of the National Weather Service’s climate services branch called the traditional 30-year base “essentially worthless” as a benchmark for decision-making in a changing climate.
The quiet consequence: “above normal” every day
A too-cold yardstick changes how weather sounds. When most days land “above normal,” audiences hear it as endless anomaly — weather gone strange — when much of it is simply the new baseline. In Stockton, California, for example, 60.7% of days from 2016–2025 exceeded the official normal high. If the yardstick were honest, that number would be near 50%. The drift hides climate change in plain sight: it converts a permanent shift into an endless series of “unusual” days, each one easy to shrug off.
What the Climate-Adjusted Normal is
The Climate-Adjusted Normal answers a simple question: if the normal is centered on 2005, what does it look like moved to today? The method:
- Start from NOAA’s official normal — the same 1991–2020 number every forecast uses. Nowmal never replaces the official record; it builds on it.
- Measure the local warming rate from NOAA’s homogenized county climate record (nClimDiv), which corrects for station moves, instrument changes, and other artifacts that contaminate raw thermometer readings. The trend is fit with NOAA’s published hinge-fit approach — flat before 1975, linear after — month by month, because warming is seasonal: in most U.S. counties, winter is warming considerably faster than summer.
- Advance the normal 20.5 years, from its 2005 center to the present.
The result is a projection, clearly labeled as one — a more honest yardstick, not a forecast, and not a replacement for NOAA’s official numbers. Every county page shows both so you can see the gap for yourself.
What we found, nationally
- The drift is nearly universal. Of 3,136 U.S. counties, the overwhelming majority show a warmer climate-adjusted normal; the median year-round gap is +0.7°F.
- Winter leads almost everywhere. In most counties the gap is roughly twice as large in January as in June — a seasonal fingerprint a single annual number erases.
- A few places have barely drifted. Parts of the Southeast — the well-documented “warming hole” — show little change, and a handful of counties even run slightly negative. Nowmal reports those too, because a yardstick you can trust in Boston has to be equally honest in Alabama.
Don’t take our word for it
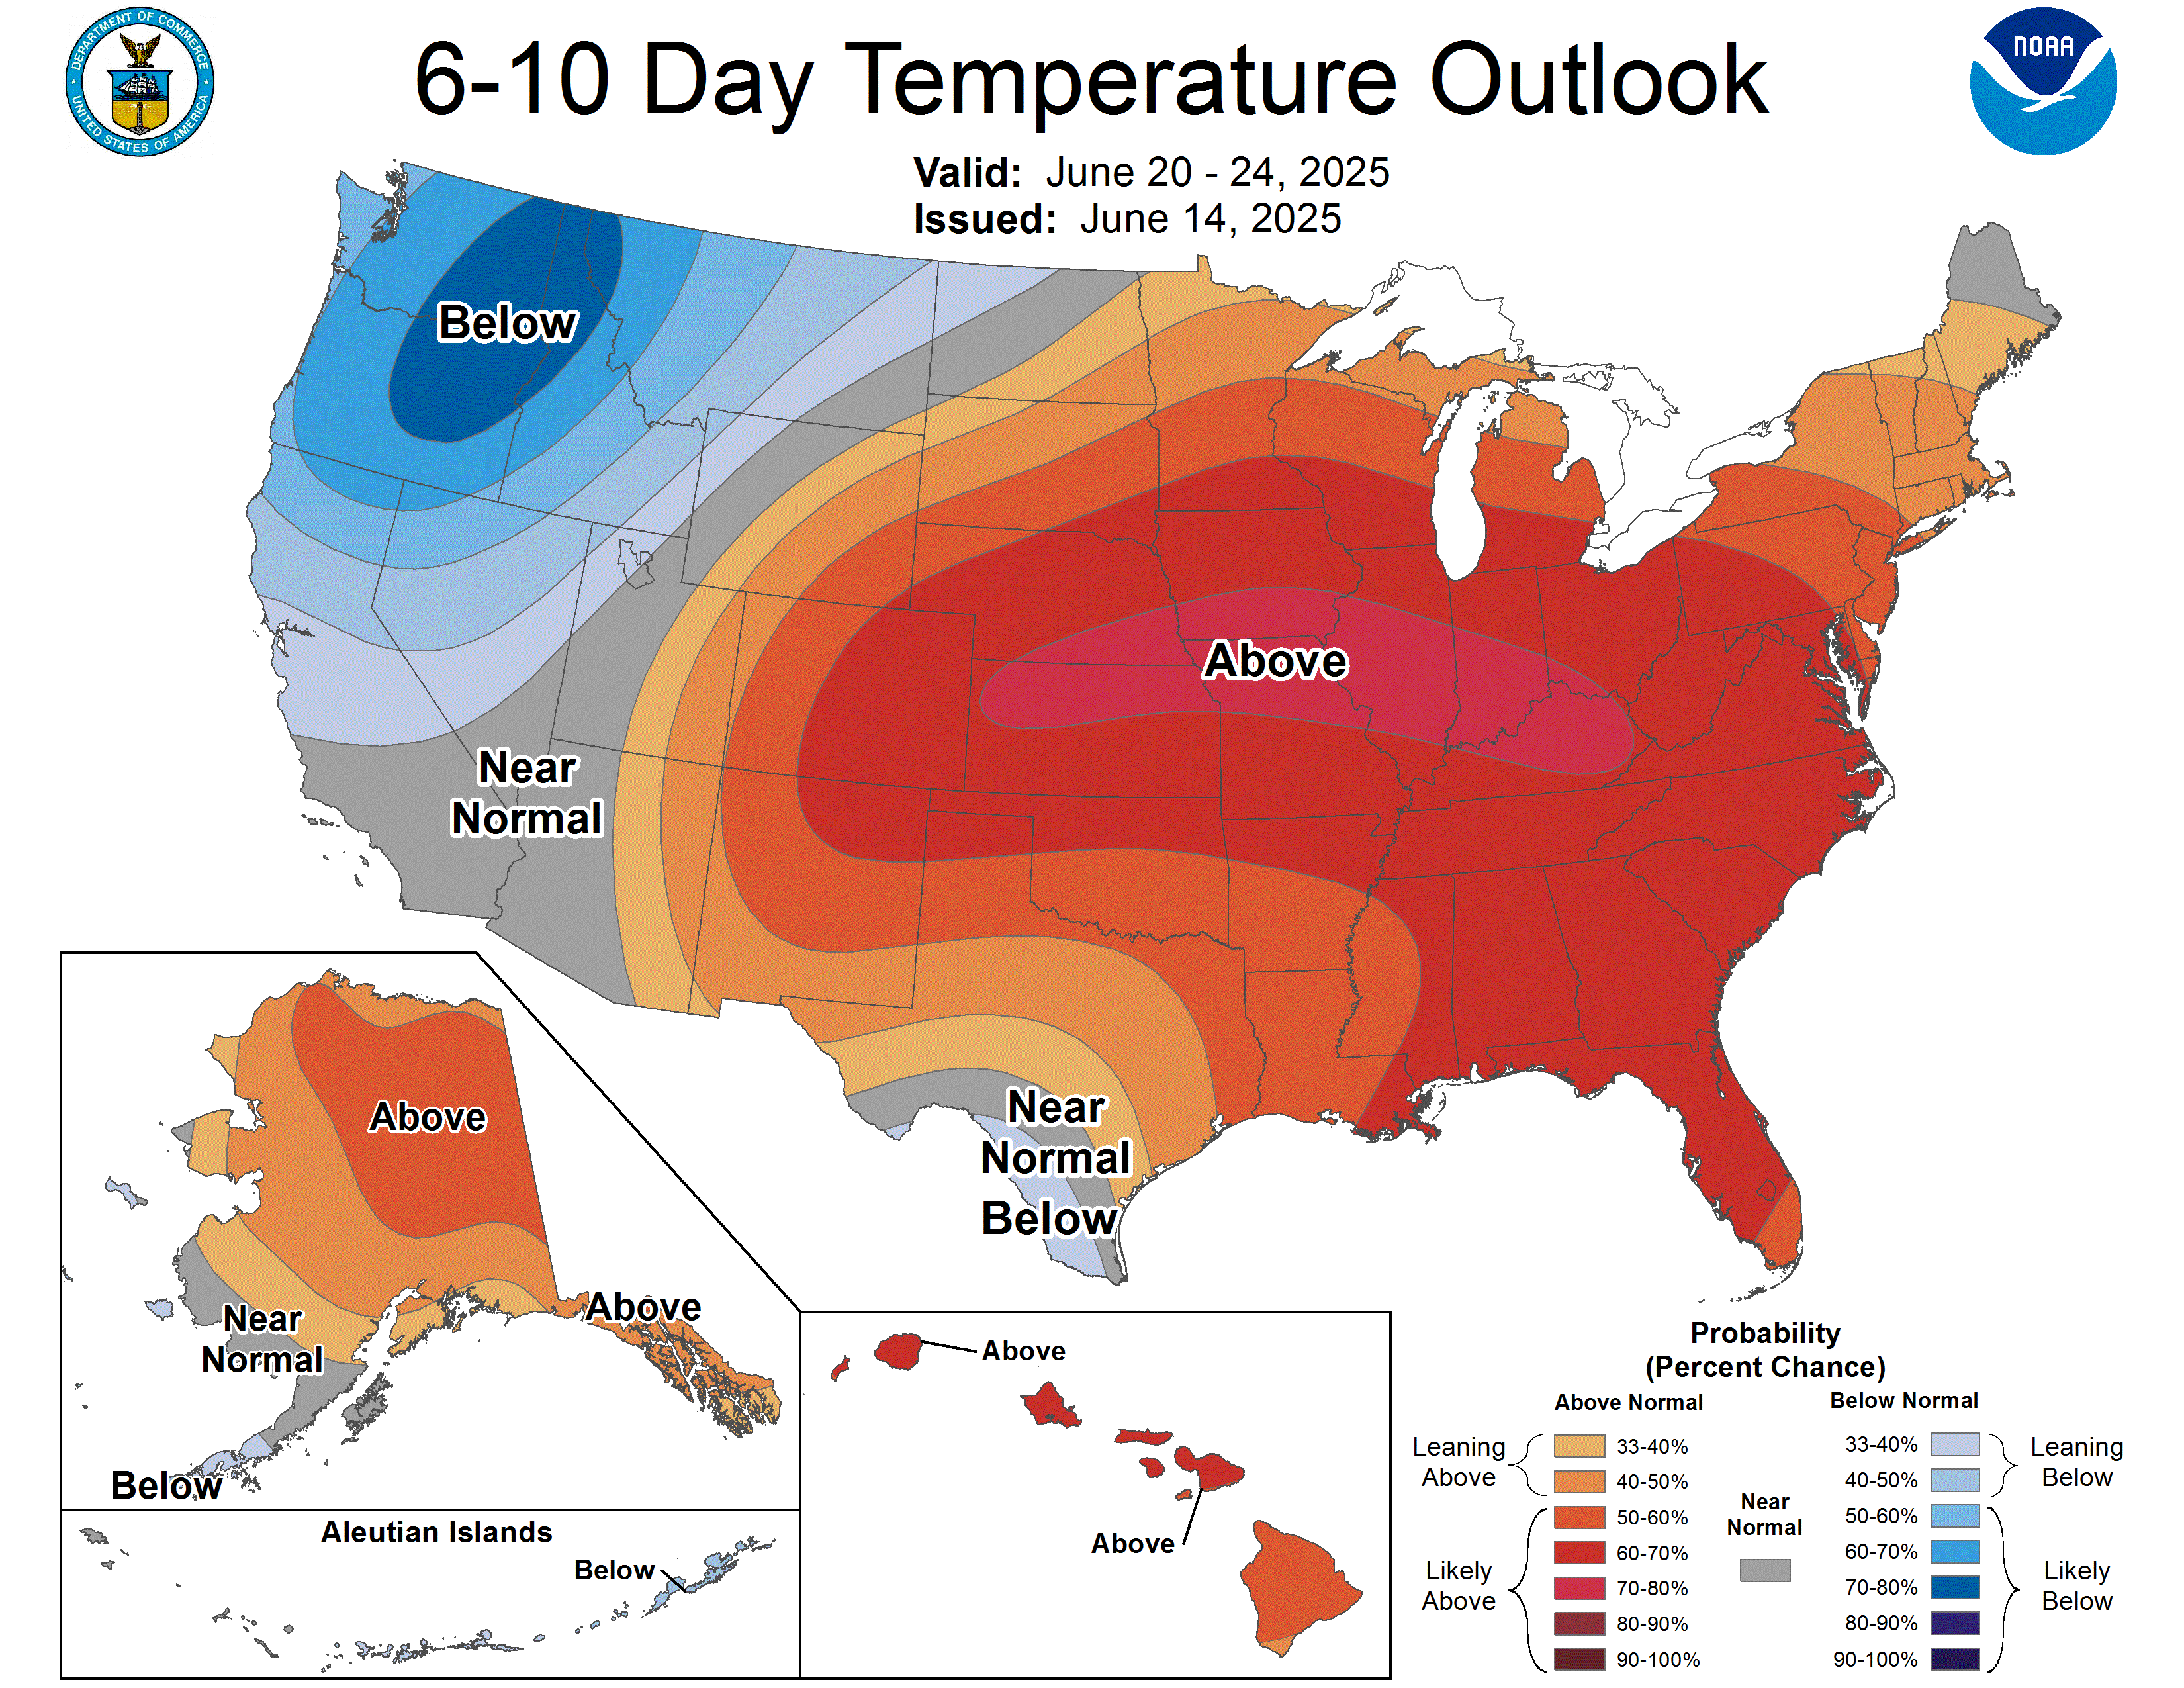
The official odds of above- vs below-normal temperatures, updated daily. Spot the pattern: “above normal” is the house favorite. Source: NOAA CPC
Frequently asked questions
- Is this a forecast?
- No. The Climate-Adjusted Normal is a baseline — a statement of what typical weather for a date looks like in the present climate. Forecasts come from NOAA’s National Weather Service and are not affected by this site.
- Is this NOAA data?
- Yes — every input is public NOAA data: the official 1991–2020 U.S. Climate Normals and the homogenized nClimDiv county temperature record. The adjustment method (hinge-fit trend extrapolation) comes from NOAA’s own published research. Nowmal is not affiliated with NOAA, and the adjusted number is ours, not theirs.
- Why not just use the last 10 years as the normal?
- A 10-year average responds faster to warming but wobbles badly — one hot or cool spell moves it. A fitted trend uses the entire 130-year record to separate the climb from the noise, then reads off the current value. NOAA research found trend methods and short averages each beat the 30-year normal at tracking the present; the trend is the more stable of the two.
- Why does my county show a small gap?
- Warming is not geographically uniform. Parts of the Southeast in particular have warmed little since the mid-20th century. A small number means your county’s official normal is still close to honest — and Nowmal shows it because cherry-picking only dramatic counties would make every number less trustworthy.
- Why counties and not cities?
- The warming trend is computed at county level because that is the finest resolution of NOAA’s homogenized record — and because climate trends vary smoothly: towns twelve miles apart warm at statistically indistinguishable rates. Trends computed from single raw stations are unreliable; a single instrument change can swing them wildly.
- When does this update?
- Annually, when NOAA finalizes each year’s county climate data — and the whole site will re-baseline when NOAA releases the 2001–2030 normals in 2031. If the climate stopped warming, the Climate-Adjusted Normal would converge back to the official one. We would be delighted to report that.
Okay, it’s bad. Now do something.
Three days and 27 hours of live programming, ending with the countdown of America’s 100 fastest-growing purpose-driven companies — climate innovators like TerraCycle, Aquacycl, and Azure Printed Homes among them. Streamed on SuperCrowd.tv, Roku, and Fire TV. No flights required.
Superpowers for Good — a top-100 Substack in Climate & Environment — covers the founders fixing real problems and the ordinary people who fund them. Something to do besides recycling.